Extra

Latest Mostly Via Weather Prediction Center, National Drought Mitigation Center & Climate Prediction Center

Seven Day Precipitation Forecast:
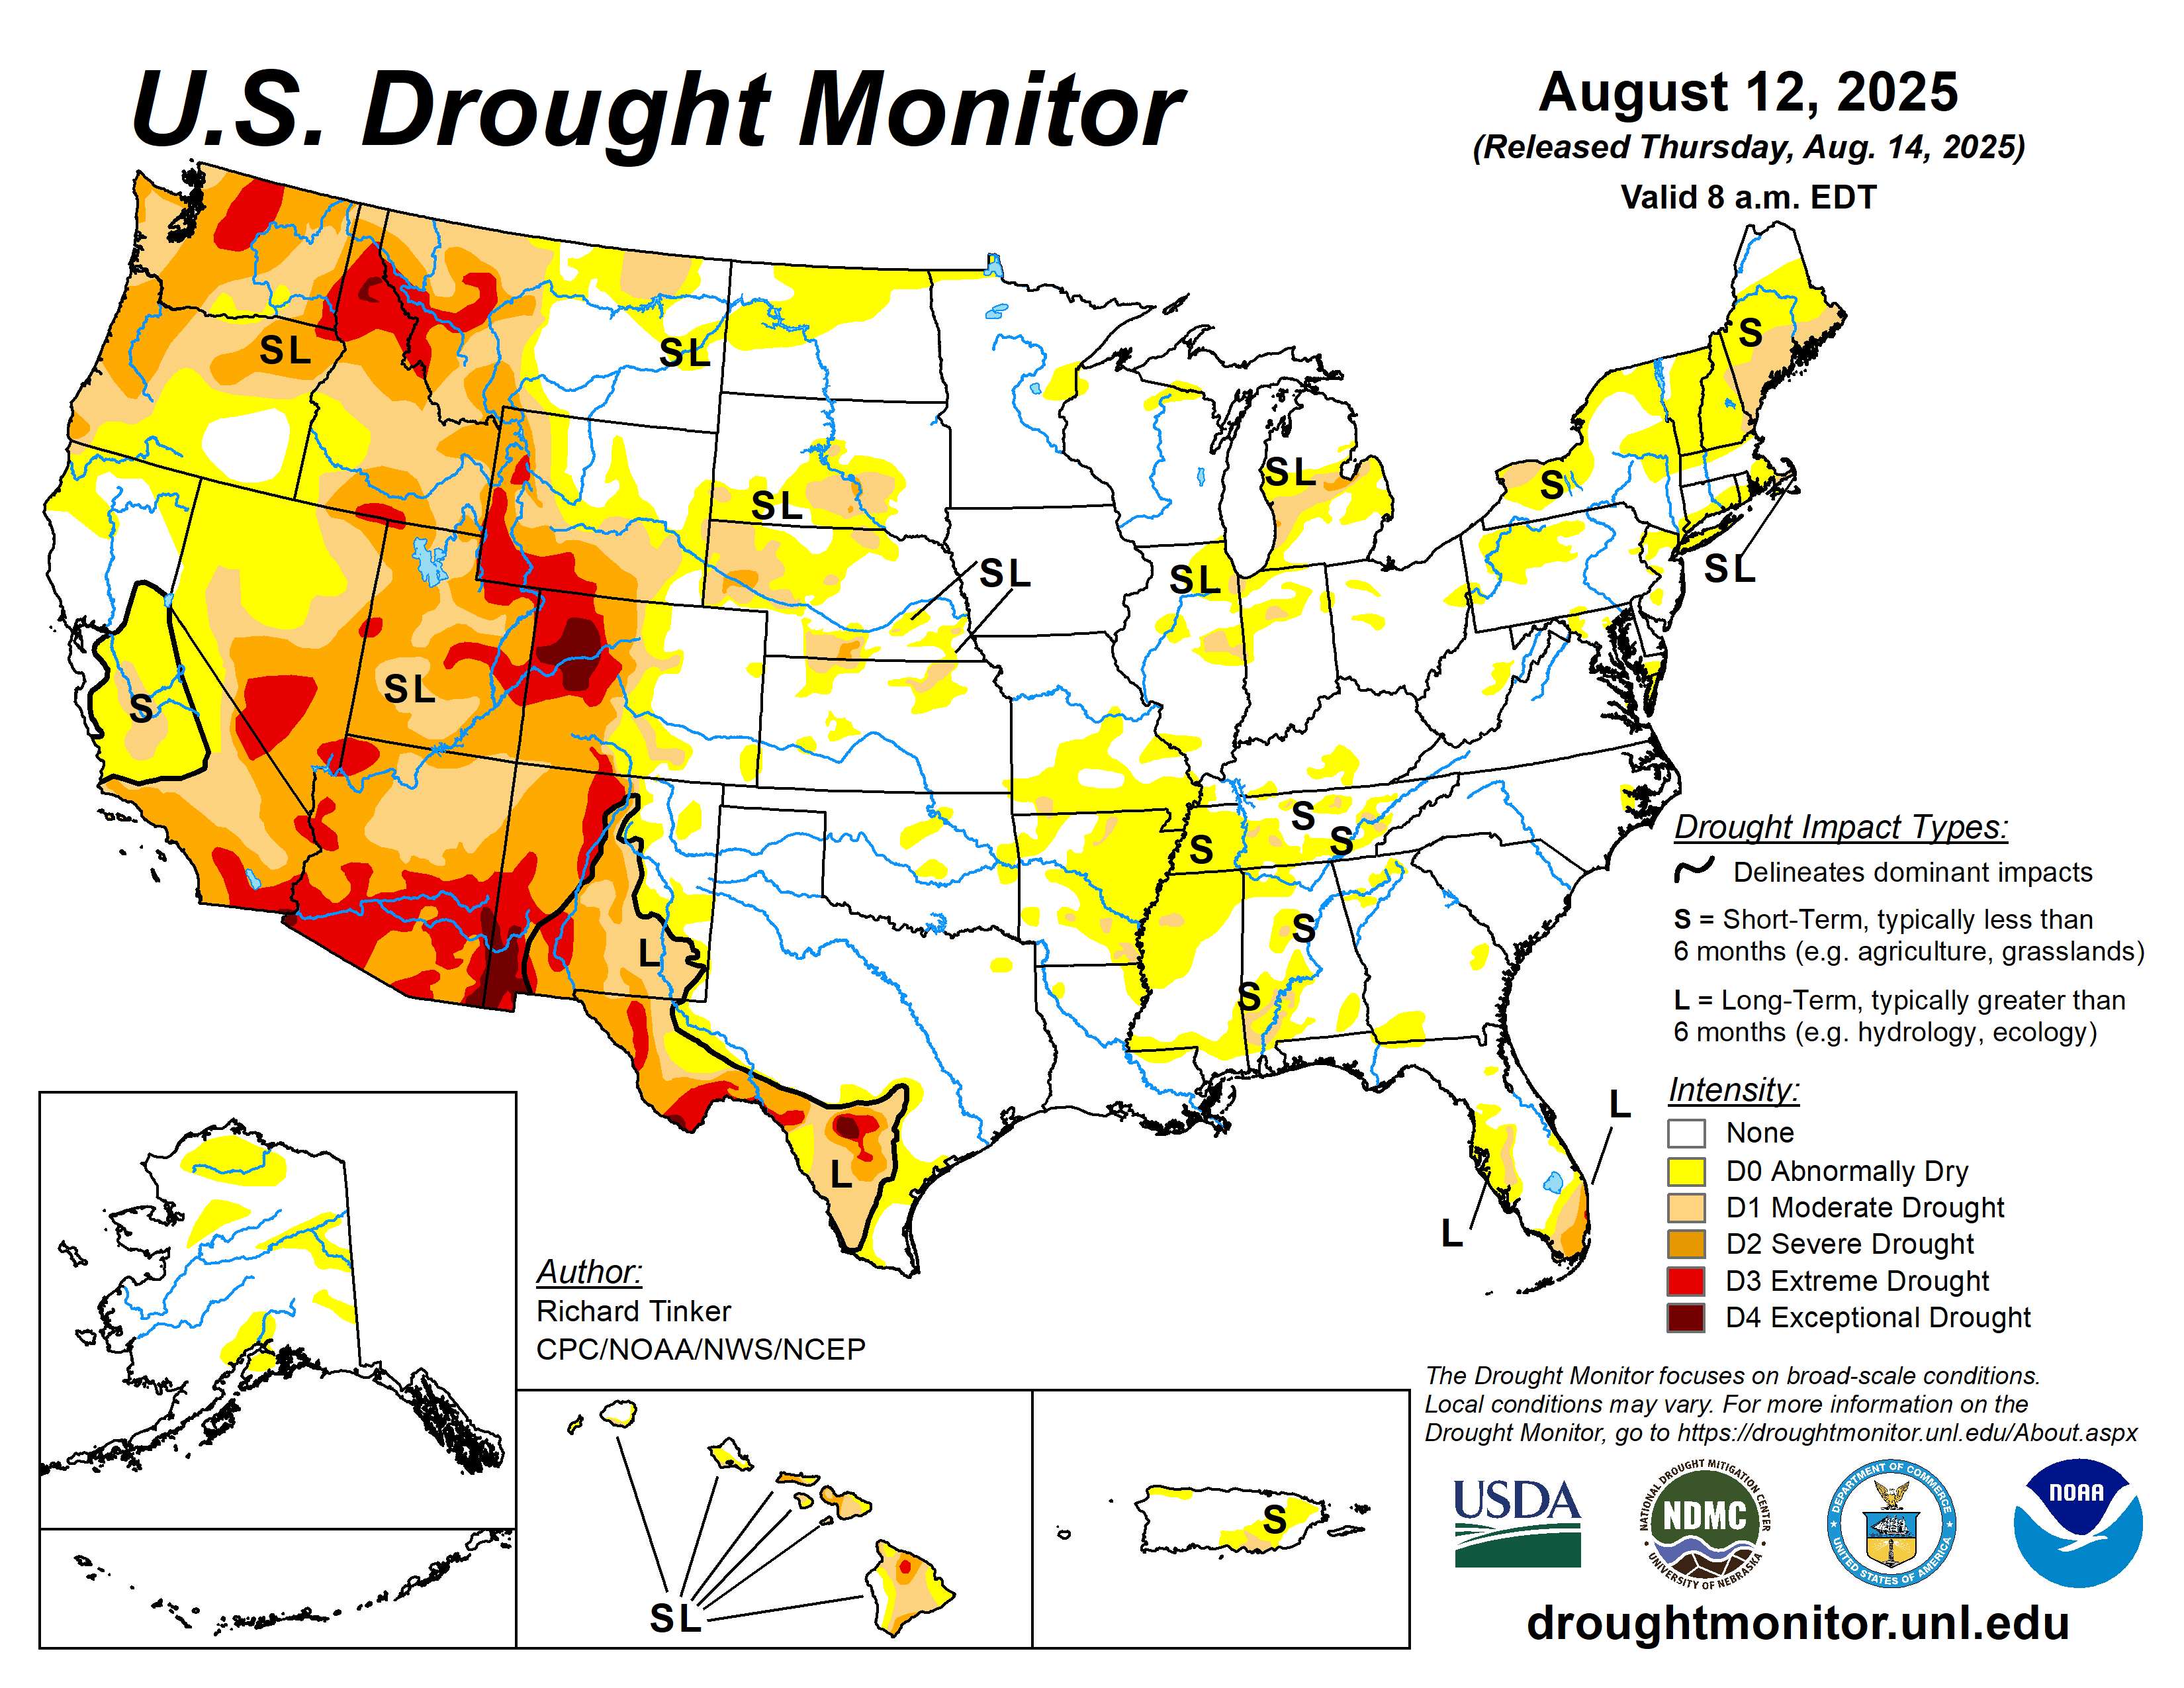
Weather forecast map showing estimated precipitation across the United States for a 168-hour period, with varying shades of green, blue, and red indicating different levels of rainfall. Go to wpc.ncep.noaa.gov for the latest information and more details.

Drought Monitor:

A look at the weekly drought update for North Florida and adjacent South Georgia.

U.S. Drought Monitor map showing drought levels across the United States. Areas are color-coded to indicate drought severity, with a legend for short-term and long-term impacts. Go to droughtmonitor.unl.edu for the latest information and more details.

Precipitation Outlooks:

Map showing the 6-10 day precipitation outlook for the United States, with areas marked for below normal, near normal, and above normal precipitation probabilities. Go to cpc.ncep.noaa.gov for the latest information and more details.

Map displaying the 8-14 day precipitation outlook for the U.S., showing areas of above, near, and below normal precipitation probabilities. Go to cpc.ncep.noaa.gov for the latest information and more details.

Temperature Outlooks:

Map showing the 6-10 day temperature outlook for the United States, with color-coded regions indicating temperature probabilities: below normal, near normal, and above normal. Go to cpc.ncep.noaa.gov for the latest information and more details.

A weather map showing the 8-14 day temperature outlook for the United States, highlighting probabilities of above, near, and below normal temperatures across different regions. Go to cpc.ncep.noaa.gov for the latest information and more details.

Flood Alert Differences:
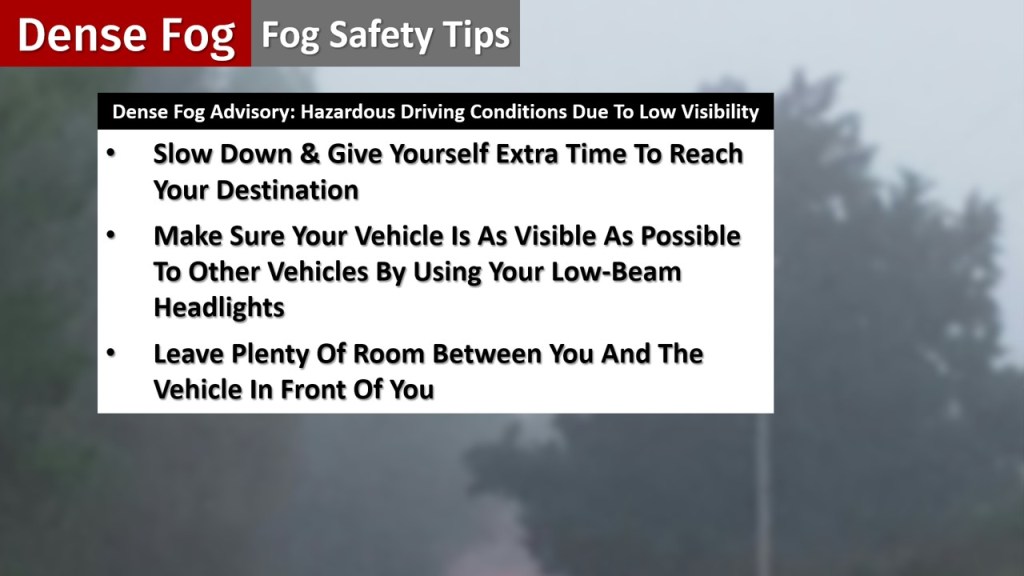
Graphic comparing Flood Warning and Flash Flood Warning with details on their significance and urgency.

Fog Safety:

Image displaying fog safety tips including a Dense Fog Advisory and recommendations for safe driving during low visibility conditions.